Choosing
Stop Level Strategies - Defining Strategies
For Success
Choosing
proper stop levels after placing an entry
order is almost the most critical part
of protecting open trades. If they are
too tight, trades will possibly be stopped
out frequently with losses. If they are
too wide, they may not be as effective
in protecting against unwanted losses.
Where in the heck do we place our protective
stops so that they are perfect? This is
the question In intend to try to solve
for you.
The
way I try to look at this problem may
be a bit different than other people.
I look at it as we have to adjust stop
strategies according to the timing of
the trade (beginning, middle or near the
end), to the conditions of the market
(strong or weak), and to the potential
outcome of our actions.
Keeping
this in mind, I’m sure you have quickly
realized this section will go into many
different issues – and you’re probably
right. The main thing to remember here
is “what are we trying to accomplish with
the stop?” and thus “where should it be
placed?”.
Entry Order Protective Stops
Entry
order stops are designed to be our first
defense against excessive draw downs and
losses. They should be considered as part
of our “What If I’m Wrong” strategy –
basically as a floodgate preventive measure
to protect equity. So, where do we place
our initial entry order protective stops?
We must consider the most recent market
price action and use current support resistance
levels to try to determine the most logical
stop price level as well as the most appropriate
level to try to let our trade mature into
profits.
When
placing stop orders, we really need to
consider what we expect the market to
do in the future and how much we are willing
to risk. Of course, if we could risk nothing,
that would be the ideal solution to this
problem. There are some instances where
we can risk almost nothing, but in most
cases, some level of risk is inherent
in every trade.
Entry
Stop Level Example #1:
In
this example, we explore the use of support,
resistance and conservative market expectations.
Let me explain all the lines and stuff
on this chart to help illustrate the example…
The
lines near the upper portion of this chart
reflect resistance. The resistance levels
I chose were based on the downward sloping
trend channel (originating from the previous
bearish trend) and the double Doji formation.
Often, the body’s of Dojis are actual
support or resistance. Most people don’t
know this – so you might want to remember
this.
The
other lines on the chart are support.
Of course, the low of the chart is our
most substantial support level. But there
are other support levels on this chart
too. The shaded area created by 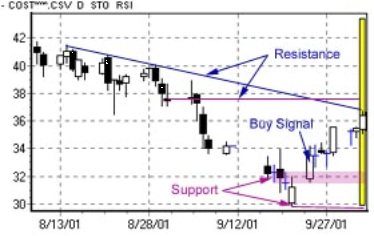 the
two Dojis, just before the bottom, indicate
a “support range”. With a support range,
we are essentially identifying a narrow
price range that should act as a secondary
support level. In this case, the low of
the candle that issued the BUY SIGNAL
helps to confirm our support range. the
two Dojis, just before the bottom, indicate
a “support range”. With a support range,
we are essentially identifying a narrow
price range that should act as a secondary
support level. In this case, the low of
the candle that issued the BUY SIGNAL
helps to confirm our support range.
What
we should realize when the BUY SIGNAL
is issued with this chart is the following….
1.
The current downward sloping resistance
channel is still in tact and will present
a potential for a retracement if the market
continues upward to reach this level.
2. Knowing the potential for a retracement
and the potential price level where it
might occur, we can estimate potential
$4.00~4.50 profit target range (initially).
3. We also know that support exists near
$30.00 (the most recent low) and the $31.50~32.50
level.
This
means that if we are lucky, our LONG MARKET
ORDER will be filled near the close of
the candle that issued the buy signal
(or about $33.50). If we get really lucky,
the open of the following session will
be a bit lower.
So,
realistically, we should place our stop
at or below $30.00 – right? Probably not.
It is acceptable to place a stop near
the $30 level simply because it is our
most concrete support level, but because
we are only expecting a $4~$5 profit target,
a stop that is $3+ away from our entry
would reduce our risk/reward ratio to
less than 2:1.
The
most appropriate stop level for our entry
order is the support range created by
the Dojis (or $31.50). I understand that
this stop price adjustment only increases
our risk/reward ratio to about 2.5:1,
but realistically, this support level
has to hold over the next few trading
sessions for the market to attempt higher
price levels.
So,
we would place a GTC SELL STOP ORDER at
$31.50 to protect our trade. Once the
market price accelerated away from our
entry price, we would consider adjusting
our stop price accordingly. We’ll learn
more about this technique in the “Mid-Trade
Protective Stops Adjustments” section
of this book.
Entry
Stop Level Example #2:
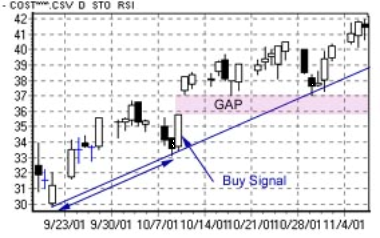 In
this example, we explore the need to immediately
modify our entry stop price level because
of a price gap. This is an important factor
of trading because gaps normally act as
support or resistance as long as the gaps
are not broken with price action. In
this example, we explore the need to immediately
modify our entry stop price level because
of a price gap. This is an important factor
of trading because gaps normally act as
support or resistance as long as the gaps
are not broken with price action.
The
candle that generated the BUY SIGNAL also
presented a new, potentially substantial,
trend channel. It is important that we
identify this new trend channel as it
plays into our expectations of future
price activity. The line with the double-arrows
indicates the two valleys where we identified
the price channel.
When
the buy signal formed and we placed our
entry order, our only support level (or
stop level for our entry trade) was the
support trend channel. So, we would have
initially placed our GTC SELL STOP ORDER
at $33.25 (or just below the current lows).
The
following day, the market GAPS up sharply
and we get filled on our entry order above
$37.00 (now nearly $4 away from our stop).
The price gap created additional risk
in our trade that we should immediately
attempt to reduce or remove.
The
most appropriate strategy in this type
of situation is to move our stop below
the low of the price gap (in the case
of a Long Trade and a Bullish Price Gap).
So, we would immediately most our stop
to the lowest level of the price gap as
soon after we are filled as possible and
wait to see what happens. The gap will
act as support for the market and we should
be watching for any breach of the upward
sloping trend channel as a sign that the
market MAY REVERSE.
In
the event of a bearish price gap after
a sell signal, we would do the exact same
thing except we would move our stop to
the high of the bearish gap range.
Entry
Stop Level Example #3:
In
this example, we explore the need to immediately
modify our entry stop price level because
of a large range entry bar. Sometimes,
a candlestick bar will be much larger
than a normal bar. This is normally a
good sign for the future trend, but can
distort our risk/reward ratio simply due
to the increase in volatility. It is often
necessary to adjust our entry stop price
level immediately after our entry order
is filled simply to reduce the amount
of risk.
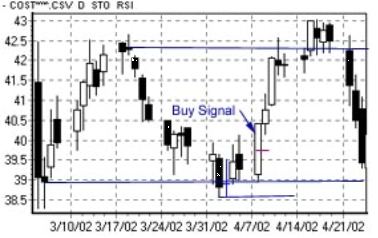 In
this example, we first notice the support
level near $39 and the previous top near
$42.25. Even though this is not a huge
range, it is a decent range to trade (about
$4). In
this example, we first notice the support
level near $39 and the previous top near
$42.25. Even though this is not a huge
range, it is a decent range to trade (about
$4).
As
you can see, the candlestick that issued
the buy signal is LARGE and closes at
almost $40.50 (only $2 away from our profit
target). Where do we place our stop on
this trade?
This
is where we begin discussing the “Waist
Line” of the candle, or the exact midpoint
of the high~low range (shown here by the
short Magenta line). The waist line should
be used for large range candles as a support/resistance
level – especially if we are attempting
to protect a position.
Initially,
our stop price level should be near $39
because of the support that goes back
to the base near the left edge of the
chart. When our order gets filled at $40.38
and we realize we were not filled anywhere
close to our stop (or within the body
of the previous candle), we soon realize
we need to make some adjustments to our
opening stop level.
As soon as our market order gets filled,
we need to adjust our entry stop price
to the “Waist Line” of the large white
candle (or near $39.68) to help reduce
our risk in the trade.
We’ll
get another attempt to use another “Waist
Line” only two days after our entry trade.
Another large range white candle forms
in our bullish trend and this time we
would adjust our stop level to $41.50
in an attempt to secure some profits and
take advantage of the natural support
level that is the “Waist Line” of large
range candles.
Closing
Comments On Entry Stop Levels:
There
are many ways to develop entry stop level
strategies, yet I find the traditional
support/resistance and recent price action
methods are still the best. I’ve had many
people tell me about “parabolic curves”
and “Dochanian Channels” (which might
be fine for your trading style), but have
yet to find something that beats the price
chart.
I
think it all boils down to “our ability
to understand the charts” and the Japanese
saying “if you want to know where the
market is going, ask the market”. In other
words, you can get almost everything you
need right from the price chart. You should
never move an entry stop level lower –
unless you WANT more risk or find an error
in your initial stop evaluation.
Mid-Trade
Protective Stops Adjustments
Mid-trade
protective stop adjustments are price
level adjustments to an active stop order
that are designed to accomplish any of
the following benefits…
1.
Move a stop level to “break-even” or “into
profits”
2. Move a stop level to protect profits
3. Move a stop level to protect against
potential weakness in the market
4. Move a stop level because of a previous
error in establishing a protective stop.
Items
#1 through #3 are designed to help you
increase or maintain profits in your trade.
Item #4 can be a benefit or a more disastrous
move – depending on the reasons and actions
taken.
The
easiest way to understand when and where
to move a mid-trade protective stop is
to understand a few basic principles of
market price action. Are you ready???
Price
Acceleration
- Most market trends react in “bursts”
of trends, with congestion periods following
bursts. These accelerations in market
price should be watched for and used to
you benefit. Normally, these bursts occur
as the market attempts to move away from
support or resistance. We’ll learn more
about how to use these price bursts in
a few more paragraphs.
Market
Breathe
- Market Breathe is the markets “natural
rhythm”. Most price trends don’t go straight
up or down – some do though. Most trends
move up or down in a “wavy” type of price
motion. This is essentially market breathe
– or the natural ability of any market
price to move within a trend, yet still
oscillate up and down (like “micro-trends”).
Support/Resistance/Trend
Channels
- I know you’ve all heard it before, but
no matter what anyone tells you, support,
resistance and trend channels are derived
from market price – so they are essentially
a price pattern and are critical to our
understanding of the markets. I have taught
a few tricks and a few common techniques
in using these “facts of price” and we’ll
continue to learn more.
Market
Intuition
- Intuition – how do you teach intuition?
Well, you’re already learning it – you
probably just don’t realize it. Every
little hint I can offer you and every
example in this book are designed to help
guide you through a trading decision.
I can’t give you intuition, but I can
help you refine and explore your ability
to become more intuitive regarding market
price.
Lets
go over some simple guidelines for adjusting
stop price levels before we get into the
examples. This way we can try to consider
the necessary process for adjusting stop
levels effectively.
After
you place your entry stop price level,
the only reasons why you would want to
immediately adjust this existing level
are as follows….
1.
Your order is filled much higher or lower
than you expected and there is now additional
risk in the trade (the filled price is
too far from your stop price).
2. The market gaps up or down on the bar
you were filled. The gap represents support
or resistance. Move your stop to the low
of bullish gaps or the high of bearish
gaps to protect your trade.
3. Your order gets filled near the expected
price, but continues to rally extensively
or sell off excessively. This means that
your trade was correct and you are already
seeing profits. But it also means that
your stop price level may include too
much risk. This is where you would either
use the Waist Line of a candle or the
most recent lows as your next stop level.
NEVER
RE-ADJUST YOUR ENTRY STOP PRICE TO INCLUDE
GREATER RISK
unless you are completely sure of what
you are doing. The only reason I could
think of where you would want to do this
is if you made a serious mistake placing
your original stop.
After
placing the initial entry stop price level,
we should be expecting the market to move
away from this level and begin to show
profits. There should be no reason to
modify this level unless we really screwed
up. Now, the only reasons we would choose
to modify the stop price level is as follows…
1.
The market has accelerated away from our
entry price and we want to trail our stop
to protect our interest in this trade.
2. The market has congested after our
entry trade and we want to move our stop
to a new support or resistance level –
thus effectively reducing the risk within
our trade.
3. The market price has moved up excessively
and we want to attempt to trail our stop
to lock in some profits. Another attempt
to lock in profits would be to liquidate
a portion of our portfolio and trail our
stop to a new level.
This
about covers the necessary processes of
adjusting stops. Remember, traders use
stops to protect and to limit losses,
as well as to try to lock in gains. A
stop level that is too tight will most
likely get hit and stopped out (with a
small loss). As you become more aware
of the Principles of Market Price Action,
your skill at placing stops and trailing
stops will become more effective.
Let’s
move onto some examples… We’ll use the
same examples we used for the Entry Stop
Price Levels – OK?
Mid-Trade
Stop Price Adjustment Example #1
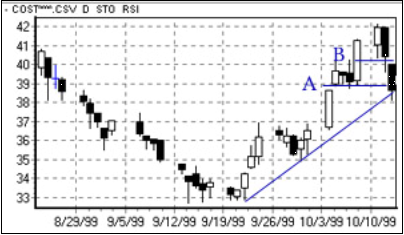
This
example uses the same entry as the Entry
Stop Example #1 & #2 – it just carries
the analysis a bit further. In this example,
I have labeled all of the points of interest
with A through I. We’ll go through them
in order to illustrate my points.
I
thought I should mention that an alternate
mid-trade stop adjustment strategy would
be to simply adjust your stop to just
below the support channel (shown below).
Of course, we would not know the support
channel actually exists until after “D”,
but this type of stop trailing method
is very acceptable under these circumstances.
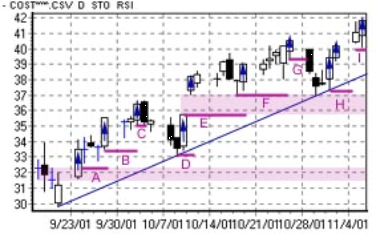 A.
As shown in a previous example, our initial
entry stop level would be near this point
(or somewhere within the support range).
At this point, we are simply waiting for
the market to begin accelerating upward
before we attempt to tighten our stop. A.
As shown in a previous example, our initial
entry stop level would be near this point
(or somewhere within the support range).
At this point, we are simply waiting for
the market to begin accelerating upward
before we attempt to tighten our stop.
B.
This bar is an acceleration bar (with
a high close, higher high and higher low).
Another good example of an acceleration
bar is “any bar with a higher close and
where the body is greater than half of
the total candle range”. At this point,
we would move our stop to just below the
current low (which would bring us to nearly
“break-even”).
C.
This bar is another acceleration bar.
We don’t know the retracement is coming,
so we can’t forward optimize our decision-making.
All we can do is move our stop to just
below the low of the most recent bar –
which locks in some profits and protects
against a POTENTIAL pullback. Within to
more trading days, we get stopped out,
but we have trailed our stops accordingly
and have used the market price action
to dictate where to place our stops. Our
profit was about $1.40 per share.
Now,
our stop has been breached and we have
completed our first trade. At this point
we would be watching the chart to see
what happens.
D.
At this point, we see a new BUY signal
and would establish a new trend channel
(using the past bottom and the recent
potential base). We would place a new
entry stop at a level equal to, or just
below, the support channel to protect
our trade
E.
Our order (at “D”) gets filled much higher
than we expected because of a price gap.
We would immediately move our stop price
to just below the price gap – where support
is likely to be found. Next, we wait to
see if the market accelerates again and
stays above our new trend channel.
F. This candle is an acceleration bar
even though it was not able to close at
a higher price level than the previous
candles. The size of the candle body was
the clue here. It is very large compared
to the total candle range. Thus, we would
attempt to move our stop a bit higher
(near recent lows) – which would move
our stop price to near break-even.
G.
After about 4 days of congestion, we see
another acceleration bar with a higher
close. The congestion that preceded this
is a sign of weakness, so we would want
to move our stop to the most recent low
(or even the Waist Line of the current
candle) in an attempt to protect profits.
This type of move really qualifies as
an “Exit Trade Protective Stop” – but
we’ll discuss more of that later…
The
very next bar our trade is stopped out
(with about $1.80 profit) and we are seeing
acceleration in the bearish direction.
We should now expect a retest of the support
channel. If the market price reaches the
support channel and holds, then we would
look to get back in with another LONG
trade.
H.
Another trend channel retest and a new
acceleration bar to the upside. We get
in again with an entry stop order at (or
just below) the trend channel. Again,
because of the size of the acceleration
bar and the fact that we got filled a
bit higher (far away from our stop), we
could have move our initial entry stop
to the Waist Line of the large range bar
(at “H”). Either way, we are now waiting
for another acceleration bar.
I.
Another new acceleration bar. We need
to move our stop again It is time to move
our stop into profits (at or just below
the current low) and wait to see what
happens.
I
know some of you are asking, why does
this not work the same way when I’m really
trading? Well, it can, but you have to
remember that stops are to be used to
protect positions and should be adjusted
below the most recent acceleration level.
You
might find that in the past, you were
adjusting your stops arbitrarily and thus
your stops may not have been as effective.
You should also notice that I did not
attempt to go short (or sell into) this
market – why? It is simple, we had established
a support trend channel and until that
channel is broken (substantially), the
market price should continue to go up.
Why in the world would I want to short
a stock that should continue to go up
in the future??
The
opposite side of the statement (above)
will be answered in the Options Strategy
section of this book. There are reasons
to trade a “Put Option” (betting the market
will move lower), but there are conditions
and defined profit targets that come into
play. We’ll get into this more in the
Options section, but I just wanted everyone
to know that there are ways to trade the
retracements of a bullish trending chart
by trading “Put Options”
Mid-Trade
Stop Price Adjustment Example #2
This
example uses the same entry as the Entry
Stop Example #3. Now we’ll carry it forward.
A.
As you probably remember, we entered a
LONG trade with a BUY SIGNAL at “A”. We
initially placed our stop at the support
(just below $39.00). Because of the large
range candle, as 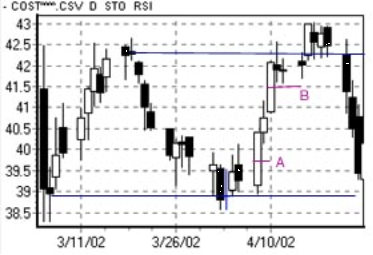 well
as the order fill location, presented
greater risk in the trade, so we moved
the stop to the Waist Line of the white
candle (“A”). The Waist Line is the exact
midpoint of the total candle range. well
as the order fill location, presented
greater risk in the trade, so we moved
the stop to the Waist Line of the white
candle (“A”). The Waist Line is the exact
midpoint of the total candle range.
After
entering our trade and immediately modifying
our stop level, we would simply wait for
the market to move and attempt to reach
the $42.50 resistance level.
B.
The day after we were filled, the market
again accelerated upward to nearly reach
our profit target – but not quite. Another
larger range (acceleration) bar, another
attempt to use the Waist Line as a stop
price level. Because of the quick acceleration
of this price trend, I would caution that
we should have expected the market to
retrace almost immediately after this
second large range bar. But it held in
there for a while and actually managed
to get above $42.50 (our profit target).
The
third acceleration bar (right at the top)
may have caused us to move our stop again
(to about $42.70), but for this exercise,
I think you get the idea. On large range
acceleration bars, look first at the recent
lows for support (and a potential stop
price level), then look to the Waist Line
as an alternate stop level. Ideally, we
want to see enough market movement to
warrant using the Waist Line. Use your
best judgment.
Closing
Comments On Mid-Trade Stop Adjustments:
Modifying
a stop price level in the midst of a trade
can be a nerve-wracking event. As traders
become more experienced with these techniques,
they will be better able to adapt to the
different conditions of the markets. New
traders, or those needing more experience,
should use the time-tested techniques
of support/resistance, trend channels
and acceleration to their advantage.
Exit Trade Protective Stops
Exit
stops are used to protect open positions
and to set a level at which you wish to
either exit out of a trade, or exit out
of a trade and reverse your trade position
(net-reverse).
Protection
of your equity in any trade is critical
for the long-term success of the trader.
We’ve all heard stories of traders getting
caught on the wrong side of a trade and
not getting out in time, or of a trader
leaving an open position on then going
on vacation only to return to a margin
call. Specifically for these reasons it
is of critical importance that all traders
actively monitor their open trades and
actively use protective and exit stops.
Think of stops as “Insurance” – just in
case something happens.
Exit
stops fall into three categories (in my
book at least):
1.
Simple Exit Stops
2. Scaled Exit Stops
3. Net-Reverse Exit Stops
Depending
on your exit strategy and the market itself,
you may choose to use just one of these
strategies, or mix them up a bit. For
example, you might choose to use a “Scaled
Exit Stop” and a “Net-Reverse Exit Stop”
to scale out of a trade at X price (say
sell 1000 of your 2000 shares), then use
the net-reverse ay Y price to net reverse
at a certain price.
The
concept of using exit stops is simple,
these strategies are used in preparation
of exiting a trade. The normal exit strategy
is simply to SELL or COVER a previous
BUY or SHORT trade. If the trader wanted
to enter this order as a GTC Exit Stop
Order, then it would be entered as follows…
I want to place a GTC STOP LIMIT ORDER
to SELL xxxx of shares @ $xxx.xxx.
In
this case, the trader is protecting the
open BUY trade with a GTC SELL LIMIT order
at (or below) a specific price. This is
the ideal method of protecting the equity
in any trade. Identify an Exit Stop Level,
then place your GTC Stop Limit order.
Lets
look at an example of how to effectively
place and use Exit Stop strategies.
Exit
Strategy Example #1 - Simple Exit Stop
A
simple exit stop strategy consists of
nothing more than identifying a protective
stop level and entering your stop order
to SELL or COVER the entire trade (all
shares or contracts). Normally, this type
of stop order is placed when the trader
senses some potential weakness in the
market or when the accumulated profits
in the trade are substantial enough to
warrant placing an order to protect these
dollars. In any event, traders should
use support or resistance levels, as well
as trend channels and the specialized
candlestick levels (neck line and waist
line) to help identify protective stop
levels.
For
this example, we will use only one chart,
a Daily Costco chart. We will discuss
the decisions involved in making and placing
an exit protective stop as well as where
and why we choose certain price levels.
Here we go….
 In
this example, we assume the trader entered
a LONG trade off of the Piercing Line
Confirmation pattern that formed where
the upward sloping trend line begins and
stayed long through most of the trend.
Now, about 3 weeks later, the market is
beginning to show signs of potential weakness
and we have accumulated nearly $7.00 profit
in the trade. Assuming we want to protect
our equity in the trade, we should place
an Exit Stop Strategy in place. Our simple
exit stop strategy would consist of the
following… In
this example, we assume the trader entered
a LONG trade off of the Piercing Line
Confirmation pattern that formed where
the upward sloping trend line begins and
stayed long through most of the trend.
Now, about 3 weeks later, the market is
beginning to show signs of potential weakness
and we have accumulated nearly $7.00 profit
in the trade. Assuming we want to protect
our equity in the trade, we should place
an Exit Stop Strategy in place. Our simple
exit stop strategy would consist of the
following…
The
gap formed here at “A” indicates potential
support near the low portion of the gap.
Knowing this fact, our trader would place
a GTC SELL STOP order at or below the
low range of this price gap to protect
profits in the event the market turns.
The
market continued to retest the support
created by the GAP and eventually accelerated
upward (at “B”).
This
should have been a key factor for our
trader as the acceleration created a new
opportunity to adjust our protective Exit
stop level and to secure additional profits
in the trade. Now, the most logical placement
of our exit stop order is at the Waist
Line of the large range candle at “B”.
This adjustment of our exit stop price
level secures an additional $1.00++ in
profits for our trader.
This
type of strategy is basically a simple
“insurance policy” whereas traders can
attempt to lock in a certain profit level
and leave the trade open in case the market
continues to rally or sell-off. The thing
to remember here is that it is a way of
protecting traders from unwanted losses.
Why is this important? I don’t know of
anyone that wants to give away money –
do you?
Exit Strategy
Example #2 - Scaled Exit Stop
A
scaled exit stop strategy consists of
placing two or more GTC STOP LIMIT orders
in a specific order to attempt to lock
in a portion of the gains in the trade
and let the remainder stay active until
a secondary stop order is reached. This
concept may be a bit difficult to understand,
but I will try to make it easy. Let’s
say we purchased a stock at $10 and it
is not at $17 and is beginning to look
weak. The scaled exit stop trades would
allow us to liquidate a portion of our
shares at one price (to lock in some profits)
and the remainder at a lower price (to
protect against unwanted losses).
Let’s
assume we purchased 2000 shares of this
stock at $10. So now we might enter a
GTC STOP LIMIT ORDER to SELL 1250 shares
@ $16.50 as our first Scaled Exit Stop
Strategy and a GTC STOP LIMIT ORDER to
SELL 750 shares @ $16.00 as our second
Scaled Exit Stop Strategy. This would
result in $20,635 gross amount of profits
from this first scaled exit trade. Balance
this against our entry purchase amount
of $20,000 and we have a $625 profit from
the trade and still have 750 shares in
a open trade in the market.
Now,
if the market rallies from this point,
our 750 shares are accumulating more profits.
If the market sells off to (or below)
$16.00, our second scaled exit stop strategy
will be executed. This second stop order
would result in $12,000 profits (750 *
$16.00). This trade would act as our insurance
policy to protect profits whereas the
first trade acted as a balancing technique
to lock in our initial capital we used
to purchase the original shares.
Traders
can adjust these values and levels accordingly
to meet their needs. In this example,
I choose to illustrate the perfect example
where our trader had accumulated enough
profits to execute the first scaled stop
order and recoup the initial purchase
price. This is not always the case. Sometimes,
traders must identify a scaled exit stop
level where the amount returned is only
a portion of the invested equity. This
technique should be used when the trader
wants to protect the trade and the initial
purchase equity, but still leave a portion
of the trade open for potentially further
gains.
Now,
lets look at a real life example with
our COSTCO chart…
Using
the same chart from example #1, we’ll
simply employ a scaled exit stop strategy
with the assumption we purchased 1000
shares at $34.50.
Using
this example and assuming our trader has
held on to the shares through the candle
at “B”, our example trader would have
achieved a profit in the trade of about
$6,800 above the purchase price of $34,500
– nearly 20%. Using the same strategy
as our hypothetical (first) example, if
our trader wanted to protect his initial
purchase price equity in this trade, the
trader would need to place a GTC STOP
LIMIT ORDER to SELL 870 shares at $40.25
(the level at “B”). This would result
is a return of $35,017.50 – covering our
$34,500 purchase price and netting a profit
of $517.50. This also leaves 130 shares
still active in the market and LONG. Our
trader would have also placed a GTC STOP
LIMIT ORDER to SELL 130 shares at $38.90
(the level at “A”). When the market fell
to this level, our trade would have been
executed and resulted in a $5057 profit.
These two trades would have resulted in
$40,074.50 in sales against our $34,500
in costs – or 16% return on investment.
You
might be asking yourself “why doesn’t
the trader simply sell all the shares
at the high of the chart and maximize
the profits”. Well, this is easier said
than done. The way I explain it is “if
it was easy to pick tops and bottoms correctly,
everyone would do it and everyone would
be super rich – right?”. Well, it is not
easy to pick tops and bottoms. In fact,
it is almost impossible to do it with
any degree of accuracy. As traders, our
primary function is to make educated trades
based on our understanding of the market
conditions and potential. Our secondary
function is to protect our equity from
losses and to protect our gains from losses.
If we can do this effectively, then we
can sustain a long-term relationship with
the markets and potentially profit from
our efforts.
Exit
Strategy Example #3 - Net-Reverse Exit
Stop
A
net-reverse exit stop strategy consists
of placing two trades that effectively
exit an existing position and reverse
(with a new Short or Long trade). This
strategy should also be followed with
ENTRY PROTECTIVE STOP ORDERS to protect
against losses. This strategy is also
a bit more advanced and I suggest that
new traders simply wait for a timely entry
signal instead of trying to “net-reverse”
with every trade.
The
“Net-Reverse Short” order is simply a
series of orders that effectively exit
a current LONG trade and a second order
that enters a reverse (SHORT) trade. So,
if our trader was LONG a stock and wanted
to “net-reverse” as a price, our trader
would place a GTC SIMPLE EXIT STOP order
to sell all of the shares at $xxx.xx price
and would also place a GTC LIMIT ORDER
to SHORT the same number of shares at
the same price as the previous order.
The net result is exiting the previous
LONG trade at n price and entering a new
SHORT trade at n price.
The
reverse of this scenario is to “Net-Reverse
Long” trade would simply exit our of a
SHORT trade by CONVERING the SHORT trade
and then using a GTC LONG LIMIT ORDER
to enter a new LONG trade.
|


