Trading Algos
Our specialized trading algos fall into two categories: internal use & public use.
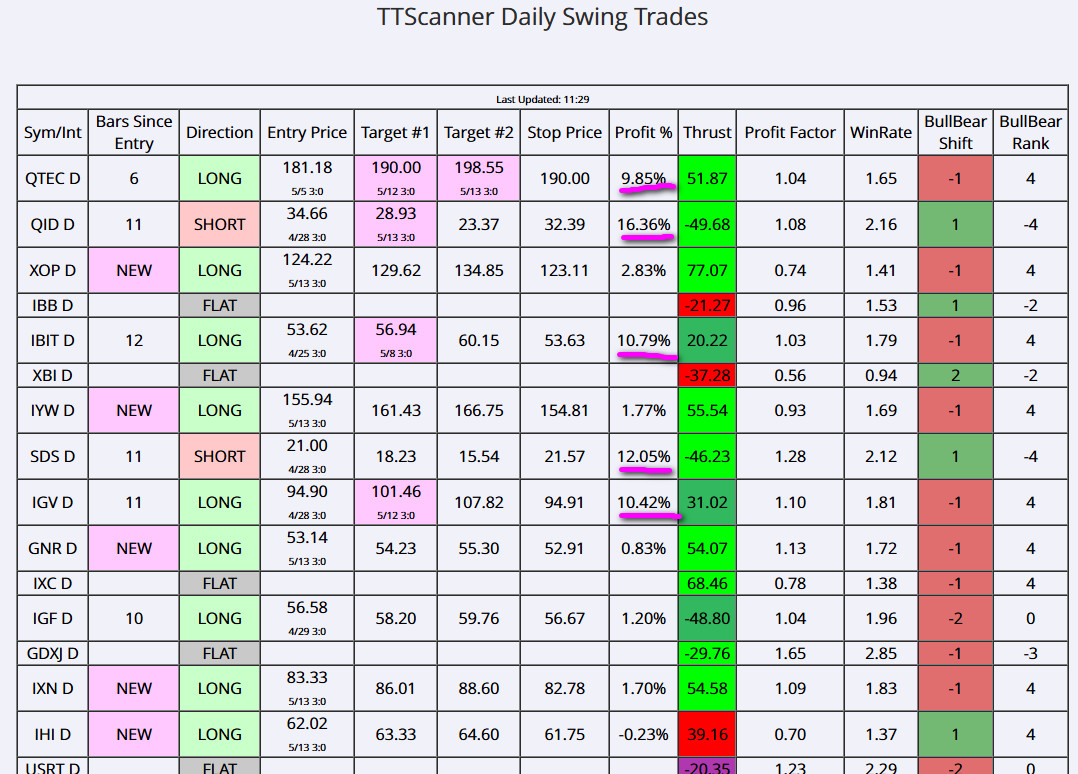
The internal use algos are the algos that drive our Predictive Modeling systems, Algo Hotlists, Daily LiveTrades signals, and are used by our research team to deliver specialized content for our subscribers every day/week. These algos are not open to public use.
Our public use algos consist of the Gunslinger TradingView indicators/tools and our selection of fully-automated trading strategies/portfolios.
Example TTScanner Intraday Algo Hotlist

-- Gunslinger TradingView Tools
The Gunslinger Tools are included with your Expert Growth membership. Otherwise, you can choose to lease them independently (without the Expert Growth subscription).
The Gunslinger tools are primarily based on a proprietary pressure indicator that reflect short and intermediate-term price pressure waves. Nearly all of the subsequent Gunslinger tools are built using this proprietary pressure indicator and deploying other specialty components to help traders better understand price action/setups.
- The MENT Daytrading Pressure System V1.0 is the proprietary pressure indicator applied to Fibonacci Price Theory constructs. It shows how price moves within waves/trends as well as shows how price constructs new higher highs or lower lows in alignment with Fibonacci Price Theory.
- The MENT Adaptive Bollinger Band System V1.0 is the proprietary pressure indicator applied to a Bollinger Band using a specialized offset & trigger process. The purpose of this indicator is to clearly show trends & momentum throughout minor price rotation/volatility.
- The MENT Fib Pressure Wave Indicator V1.0 is the proprietary pressure indicator applied to a simple Fibonacci Price Theory process tracking where price is able to establish new higher highs or new lower lows throughout a series. This indicator shows trending and measured price advances/declines as accumulated pressure cycles.
- The MENT Pressure Exhaustion Divergence V.10 system is a specialized display of the proprietary pressure indicator that not only shows trending very clearly, but also highlights “rapid-fire entry” points and “price exhaustion” points. Obviously, entries provide opportunities for traders to enter, or re-enter a trade, and exhaustion points provide opportunities for traders to pull of profits, or scale out of a trade.
- The MENT Fib Pressure Cycles V1.0 system is a very unique visual representation of the proprietary pressure indicator as a Sine Wave structure. The most incredible feature of this indicators is the ability to see pressure increasing and decreasing in a very clear up and down Sine Wave structure. Thus, allowing traders to see with bullish/bearish expansion trends are initiating or where the pressure indicator is suggesting price is peaking or troughing near the end of a trend.
- The MENT Fib Pressure Donchian Cycles V1.0 system is a specialized adaptation of the MENT Fib Pressure Cycles V1.0 system that deploys a Donchian logical trigger component to the Sine Wave Pressure Cycles. This results in a very clear visual Trending Cycle Directional component reflecting incredible trend rotation and continuation move.

-- Fully-Automated
The fully-automated strategies are designed in TradeStation EasyLanguage and are available for lease on a quarterly, bi-annual, or annual basis.
The key benefits of using our fully-automated algos is they help you manage and grow your wealth while allowing you the ability to control certain inputs (which as shares/contracts traded and other simple control variables).
Of course, as with any trading strategy or system, the key to long-term success is starting small, letting the system build wealth over the first 4 to 6+ months (usually) and then scaling the trading amount higher while building a substantial cash reserve.
Ideally, over the course of 3+ years (while living through a few ups and downs with these strategies in live trading), you should see substantial growth and consistent monthly average returns.
We usually discuss the objectives related to any potential client and clearly state the risks associated with trading any stocks or futures with our strategies. We also provide a detailed historical backtest showing the past 10+ years (if available) to allow all clients to see the real performance of the strategies.
